

Carbon Offsetting FAQ’s
Calculator
You might have problems using Safari browser. We suggest you use Chrome.
It has been explained to us by a techie that problems can occur when you are not using the Chrome browser. Checking up brought me to this information @feb 2021: Chrome is used by 64.5% of global web users ! Safari comes in second at 18.1% with Firefox at 4.1% and Internet Explorer&Edge at 1.25% !
So our advice is to switch over to Chrome.
By the by, if you have any issues with the normal running of your computer, first thing to always do is to clean up your browser cache (go to your settings page). That unclogs a lot of clutter…
This issue is a follow-on of the browser one above.
Chrome has 2 “Cookies” settings– one is the general one, the other is for 3rd parties. As PET uses a licensed calculator by Carbon Footprint Ltd (UK), when you press “Calculate and Add to footprint,” the “enable cookies” message could be activated if you’re using another browser.
What to do? Make sure you’re using Chrome. If you then open your computer’s “Settings” and type “cookies” into the search box, you should see all the cookie-settings highlighted. Check that they’re all “on.”
- The online calculators on this web site follow the methodology outlined by the UK Government, and currently using 2020 Government Conversion Factors for Company Reporting Methodology. The only exceptions to this are Country specific electricity factors:
- Many publicly available country specific electricity emissions factors are provided for free within the calculator tool. A full list of these along with the sources is provided by Carbon Footprint Ltd in “Country Specific Electricity Factors – 2020“.
- For countries where freely published emissions factors are not available, you can purchase IEA Emission Factors and enter them into the house / building tab of the calculator
- Where freely available the emissions factors provided for free include both Generation and Transmission and Distribution (T&D) losses. The calculations do not, however, include the Well to Tank (WTT) Emissions associated with extraction, refining, distribution, storage of the fuels used in the power stations.
The calculator uses emissions factors which take account of all greenhouse gases (i.e. CO2, N2O, methane etc.) released by the activities, with the results presented in units of metric tonnes of CO2 equivalent (CO2e). In most cases that means the results will be slightly higher than if calculating CO2 only. The calculations of emissions from fuels are Scope 1, meaning the direct GHG emissions from the combustion of the fuels. The calculations do not include the Well to Tank (WTT) Scope 3 Emissions associated with extraction, refining, distribution, storage and retail of the fuels.
When calculating emissions for Wood the emissions factors for Wood Pellets is used. The calculator also assumes domestic coal is used in both the Business and Household calculators.
- Secondary footprint tab.
In developed countries, transportation and household energy use make up the largest component of an individual’s carbon footprint. Such emissions are included as part of an individual’s “primary” carbon footprint, representing the emissions over which an individual has direct control (what you calculate now, on this site).The remainder of an individual’s carbon footprint is called the “secondary” carbon footprint, representing carbon emissions associated with the consumption of goods and services. The secondary footprint includes carbon emissions emitted by food production. It can be used to account for diets that contain higher proportions of meat, which requires a greater amount of energy and nutrients to produce than vegetables and grains, and foods that have been transported long distances. The manufacturing and transportation of consumer goods are additional contributors to the secondary carbon footprint. For example, the carbon footprint of a bottle of water includes the CO2 or CO2 equivalent emitted during the manufacture of the bottle itself plus the amount emitted during the transportation of the bottle to the consumer.
This issue happens when, on your last visit to the calculator, you didn’t follow the offset process through right to the end. Only by submitting payment is the calculator brought back to zero.
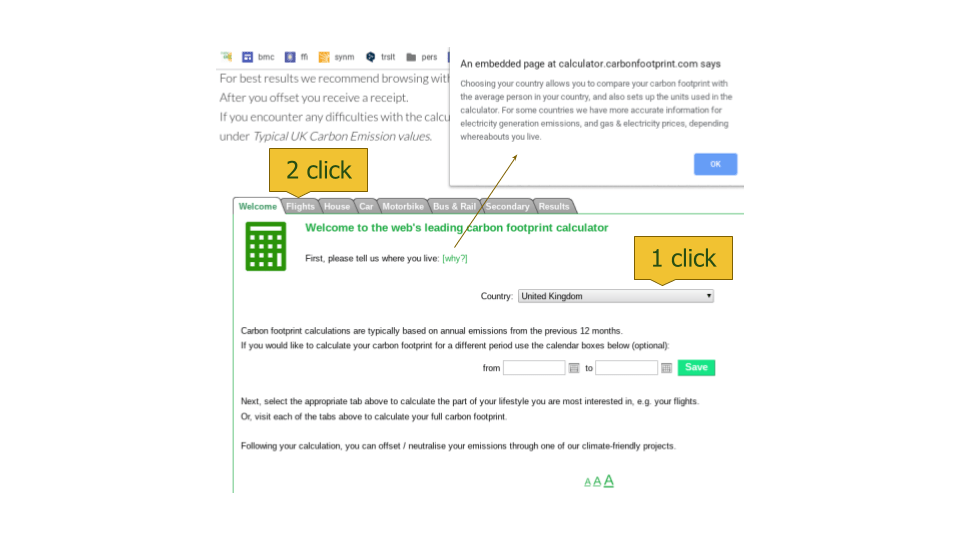
(a) Go back to the calculator, to each of the calculator tabs you used and do what’s in the image ⇒
(b) then, on the final “result tab,” check you’re now happy with the total, and click on “offset.”

Sure! There are two ways to get to the carbon calculator:
(NB: though images may have been updated, the calculator steps remain the same:)

or

This gets you here, where you can follow an hypothetical calculation and checkout step by step:
Travel [ Image Missing from current site ]

Taxi to and from the airports:

Offset some other car miles:

Offset secondary emissions (energy & travel are primary fossil fuel emitters):


Clicking on “Offset Now” brings you to the checkout (see below), where you fill in some personal descriptive information and choose your offset project (you can get a short or full version):
![]()
On pressing “Next” you’re taken to Paypal for the payment process.
The definition of carbon emissions is geography based—i.e carbon emissions that occur during activities
- of RESIDENTS of the Park & Cluny & Erraid and/or benefiting the Findhorn Foundation; or
- that occur outside the Findhorn Ecovillage Community.
The status of guests (paid FF courses, Iona retreats/courses), visitors (to the Ecovillage, casually like…), conference participants, resident Findhorn Foundation staff/longterm guests, and businesses (located in the Park Ecovillage) are reasonably self-explanatory, we think ![]() however, here are some clarifications:
however, here are some clarifications:
-
- “Other (non-resident)” is for those who are offsetting their emissions produced anywhere other than the Park Ecovillage, Findhorn, Cluny and Erraid.
- non-resident FFstaff/NFA/THA personal household emissions belong in the “Other (non-resident)” category, while
- non-res.FFstaff work & work related travel emissions are accounted for by the FF when it submits it’s offsets in the “business in the Park” category, and
- non-res.NFA&THA staff work & work travel emissions belong in the staff person’s respective resident category (unless, like the FF, NFA/THA submits work related carbon offsets
 ).
).
Any questions? Feel free to [email protected] c/o offsetting; we’re joyfully waiting to help you input your data if needed!
Projects
Our CarbonOffset Projects
- can prove that they could not have happened without carbon offset money.
This is the guarantee that your money has an effect. - are certified according to the highest international standards.
All our projects have one or more of the following standards.

![]()
![]()

 Our carbon offset Projects list offers you variety and choice. Other than simply offsetting your emissions, many projects also provide additional benefits such as
-
- developing local biodiversity,
- education,
- jobs,
- food security,
- clean water
- and health.
The price differences have to do with the
-
- size of the project,
- additional positive effects which individual projects bring, and
- the local standard of living: high cost areas have high cost projects.
Surely we should be solving our problems first…
Yes, but then again the problems are much larger in the developing world. The graph below shows metric tons of carbon emissions per capita and the number of people living in extreme poverty in various global regions over the past 30 years. What is clear is that regions that have seen extreme reductions in poverty, specifically East Asia and the Pacific and South Asia, have increased their carbon emissions by almost 200%. The only region that has decreased its carbon emissions over this time period, sub-Saharan Africa, has seen the number of people living in extreme poverty almost double.

Reducing poverty rates and boosting economic growth is at the top of many of the developing nation’s agendas. It is extremely important for the world to figure out how to decouple economic development and carbon emissions.
The short answer is therefore:
-
-
- There’s obviously a need to help ‘developing countries’ by investing in relatively expensive non-fossil fuel energy options.
- Perhaps it is a good thing for developed countries to give the example of really valuing our global-siblings’ “me-too” yearnings, rather than just protecting our superior lifestyle. We could of course decide to change the global socio-economic paradigm—whichever route is easier or more moral…
- Will, Ingenuity, Technology* and big money have proved fruitful in actually achieving the developed world’s quantum leaps in the past eg. the Space Race from 2 Aug 1955 ~ 20 July 1969. So, why not in global energy/transport areas too? Tesla is proving that W.I.T.* & cash can radically change the 1st world; so let’s also ‘push’ resources towards needier countries who desire the lifestyles we’re constantly selling—thanks only to fossil fuels).
- In the meanwhile the developed world (you and me) can do both: review/change our own life-style choices and help the poor billions who (surely) have a right to more material ‘happiness.’
-
Thus, since September 2019, PET is ‘buddying’ its UK tree planting project with its Brazilian Rainforest offset project: plant one tree+offset one tonne CO₂ respectively. In this way your ‘developed world’ carbon offset gets multiplied—neutralising your 1st world emissions and producing surplus oxygen in the ‘developing world.’
Let’s not forget that the holistic and real challenge will be to make the planet’s lifestyle choices functional, adaptable and sustainable, and not just in our lifetime.
General
We’ve got a monthly tracking spreadsheet (in excel&google) that covers the same ground as the 2020 Park Ecovillage, FindhornCarbon Assessment Survey.
We’ll send it to you for free when you [email protected] c/o personal carbon emission tracker.
If you like what we
do, you can also
the price of a
motivating
cup of coffee!

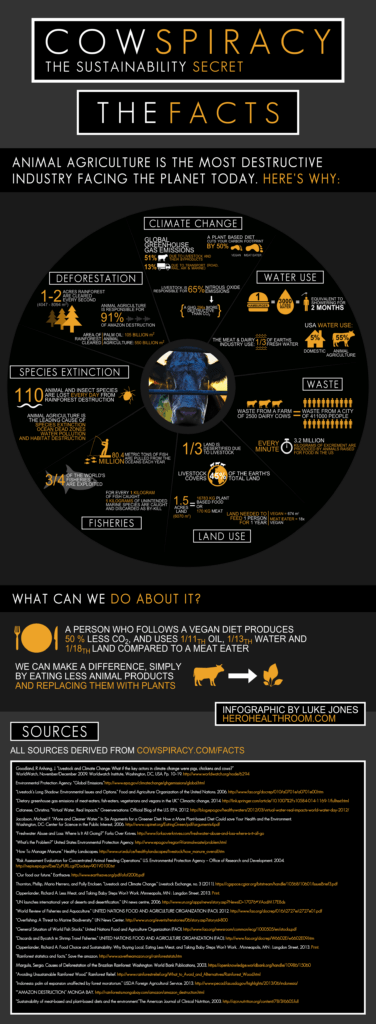
Sources: first where the above image comes from, followed by some general “greenhouse gas” info. Enjoy!
Here are the latest greenhouse gas (GHG=CO2e) figures for the UK from the Office of National Statistics.
While UK per capita GDP is growing, the manufacturing economy has decreased slightly and the service sector developed strongly. Consumption is normally the largest component of GDP.
Here are the latest greenhouse gas (GHG=CO2e) figures for the UK from the Office of National Statistics.

While UK per capita GDP is growing, the manufacturing economy has decreased slightly and the service sector developed strongly. Consumption is normally the largest component of GDP.
Which is the bigger contributor to climate warming, cows or cars? To answer this question, it’s helpful to unbundle greenhouse gases into their main constituents and recap how we (should) compare them.
Greenhouse gases are so called because they let incoming sunlight pass through but then trap heat radiated back from the planet’s surface. The most important one, and the largest contributor to the Earth’s greenhouse effect, is (perhaps surprisingly) water vapour. It probably accounts for about 60 percent of the warming effect. However, unlike other greenhouse gases, water vapour does not control the Earth’s temperature but instead is controlled by the temperature. For example, when the temperature drops, water vapour condenses into droplets that make up clouds.
Other greenhouse gases do not condense in the same way as water vapour and so the atmosphere can hold much more of them. There is a whole family of these non-condensable greenhouse gases, and they are not all created equally. Some are much better than others at retaining heat. Some are short-lived while others can last decades in the atmosphere. Some are emitted in vast quantities but are inefficient at trapping heat whereas others are emitted in only trace amounts but are extremely efficient. The principal greenhouse gases in this family are carbon dioxide, methane, nitrous oxide and fluorinated gases.
 Carbon dioxide is the primary greenhouse gas emitted through human activities. For that reason, when making comparisons, scientists convert other greenhouse gases into the equivalent amount of carbon dioxide with the same warming potential. Since greenhouse gas emissions are often calculated in terms of carbon dioxide equivalents (CO2e), they are often referred to simply as “carbon emissions”.
Methane is another principal greenhouse gas, emitted from oil and gas production and transportation; from livestock and other agricultural practices; and from the decay of organic waste in landfill sites. Methane is so pernicious because it has more than 80 times the warming potential of carbon dioxide over its first 20 years in the atmosphere. Even though carbon dioxide has a longer-lasting effect, it’s methane that sets the pace for warming in the near term.
So, back to our question of which are worse – cows or cars?
According to the UN Food and Agriculture Organisation, livestock on EU farms (including the UK) in 2018 were responsible for emitting around 502 million tonnes of carbon dioxide equivalent a year, mostly through the methane they release. When the greenhouse gas emissions associated with growing their animal feed are also taken into account, the total annual carbon emissions are 704 million tonnes. This figure compares with 656 million tonnes of carbon dioxide from all of Europe’s cars and vans in the same year.
Speaking in terms of carbon emissions – in other words, in carbon dioxide equivalents – enables us to compare the differing contributions of greenhouse gases to climate warming in an understandable way. We can do away with the complexity of a carbon footprint that consists of lots of different greenhouse gases by expressing it as a single number and focus instead on reducing that number. When we look at this number for cows and for cars, we see clearly that the question is no longer which one is worse. The real question is how do we reduce the significant carbon emissions of both?
— source+©: https://carboncopy.eco/blog/are-cows-worse-than-cars
______&&&______
There’s an elephant in the room and it’s the greenhouse gas emissions from goods we consume in the UK that have been imported. They don’t count because we choose not to count them.
Most countries generally use ‘production-based accounting’ to quantify their greenhouse gas emissions. This approach counts emissions from all activities that happen within a country’s territory – which means the emissions from goods manufactured elsewhere and then imported are not included.
It can be argued that if a country can produce certain types of goods more efficiently with lower emissions than other countries, this may be the preferred situation. From a global perspective, climate policy should recognise the advantage of producing goods where they can be made with lower emissions. But there is an important corollary to this outlook: considering only the production-based emissions of countries is not enough to address a global climate crisis. We need to consider our consumption as well as our production and assess whether our consumer demands in the UK are generating emissions here and elsewhere that are in line with a sustainable future.
In truth, we should account for both consumption-based emissions and production-based emissions. Accounting for our consumption fully would assess the greenhouse gases emitted in the production of all the goods and services we consume – imported goods as well as everything that is produced and then consumed in the UK.
We don’t count emissions from imports because they are harder to quantify than the emissions we produce in the UK. It requires tracing the point of origin of imported products, often in places with less stringent emission inventories. The most convenient thing to do is simply ignore the emissions we generate beyond the boundaries of our nation state – despite the shared atmosphere above us.
| https://trendeconomy.com/data/h2/UnitedKingdom/TOTAL |
How big is the elephant in the room? In 2016, the production-based emissions from UK produced goods and services (consumed by UK residents but not including exports) and from greenhouse gas emissions produced from household use of fuel and electricity accounted for 421 mt CO2e (million tonnes of equivalent carbon dioxide). The total emissions generated from the stuff we import accounted for 353 mt CO2e. These figures are too big to comprehend: instead, hold onto the fact that we choose not to account for around 45% of the total emissions that we are responsible for.
If we cannot partition the atmosphere, we should not ignore the greenhouse gas emissions we generate simply because they are not immediately overhead.
— source+©: https://carboncopy.eco/blog/dont-just-consume-it-count-it

Emissions from planes can stop you seeing new places very well…
In December 2015, under the auspices of the United Nations 195 countries agreed in Paris to slow global warming. Carbon emissions are its primary cause and reducing them is the primary goal of the Paris Agreement. It applies to governments, businesses and individuals, all of whom are asked to reduce their respective carbon footprints. But where further reductions are not possible, carbon offsetting is allowed and encouraged by the Paris Agreement, especially when offset projects are duly selected, monitored and verified for maximum impact. Sadly, most of our ‘local projects’ are not.
The Park Ecovillage, Findhornis committed to being part of this world-wide effort and has, among other initiatives, established a carbon offset service through the Community Charity PET. It is further supported in this effort by the Findhorn Foundation and New Findhorn Association (NFA).
PET’s Offset Projects have been chosen for their social and environmental benefits, primarily in developing countries where the effects of climate change are most severe. And in addition to reducing global emissions, offsetting there provides much needed employment, health improvement, biodiversity and social benefits to impoverished communities (project details here).
Carbon offsetting helps to combat global climate change, often functioning within the business sector as an internal ‘carbon tax’ that spurs creativity in reducing &/or avoiding emissions. In this and other respects, our offset projects also serve the UN’s Sustainable Development Goals whose realisation, together with the Paris Agreement, will create a more sustainable world.
And if you want more convincing?
Listen to this from COP24, Poland December 2018.
This is the $7bn question, isn’t it…
Check out the following clips which suggest some possible answers. We’d be happy to speak further with you about this, too! Simply let us know at [email protected] c/o WTH and we’ll get back to you asap!
(please click on the video to stop looping)
The CO₂ emission factor for electricity is taken to be 0.527 kg / kWh
There is a reduction of 25% in CO₂ emissions for the green tariffs listed.
The CO₂ factor for natural gas is 0.203 kg / kWh
Heating: the following CO₂ factors are used:
For oil: 2.96 kg / litre For coal: 3.26 kg / kg For wood: 0.10 kg / kg For bottled gas: 3.68 kg / kg
Food:
- Non-farmed fish counts as organic.
- The fertilizer used in growing food that is not organic causes greenhouse gas emissions through nitrous oxide released from the soil, and through CO₂ emissions from the manufacture and transport of fertilizer.
- Meat and dairy production generates methane from animals and slurry, and CO₂ from the energy used in farm operations.
- Food transport, packaging and processing all require energy, releasing CO₂.
- Food decomposition in landfill sites releases methane.
- Edible food can be wasted because too much is prepared, or because it has gone past its use-by date and so on.
Some greenhouse gas emissions are currently almost impossible to avoid:
methane from tilling and soil management, and CO₂ from arable farms and the operation of retail stores. These amount to around 0.2 tonnes per person/year.
Carbon dioxide is generated by the health service, schools, social services, the armed forces and so on.
You have no direct control over this amount. This amounts to 1.1 tonnes per person per year for the UK.
Transport:
- the CO₂ emission factor for bus travel is taken to be 100 g/mile
- the CO₂ emission factor for rail travel is taken to be 100 g/mile
- air travel assumes emissions of ¼ tCO₂equivalent per hour flying (roughly 500 g/mile)
Misc.:
Your miscellaneous spending is all your other spending i.e. on:
- recreation and leisure facilities
- housing
- household appliances
- hygiene
- hotels and other holidays
- furnishings
- clothing & footwear
- alcohol & tobacco
- post and telecommunications
- books, newspapers & magazines
- and so on.
Almost all of this spending will be associated with greenhouse gas emissions to some degree. Spending/year on these tends to follow size of income:
Above-average (5 tonnes CO₂) Average (3.4 tonnes CO₂) Below-average (2.4 tonnes CO₂) Much below-average (1.4 tonnes CO₂).
UK average Greenhouse gases emissions per person is 13.4t (2019)
www.carbonindependent.org (the source of the overview figures) states: “There is reasonable agreement with our estimate of 9.84 tonnes CO₂ per person per year, and with our estimate of average total greenhouse gases of 13.4 tonnes equivalent per person in 2019.
The range of figures reflects the difficulties in calculating an accurate up-to-date average figure:
- One problem is that detailed figures tend to be not up to date. The most detailed figures available for the UK seem to be those in the source figures. This is a document published in 2006, quoting figures published by the University of Surrey in 2005, based on UK Government statistics of 2002 and 2004. The total has clearly changed since then.
- It is not clear how to allow for greenhouse gases other than CO₂. The two most important are methane and nitrous oxide. Methane persists in the atmosphere for around a decade, and nitrous oxide for about a century, whereas there is much uncertainty about the fate of CO₂ emissions. So while we know that methane is generated by deforestation, and the production of rice and cattle, it is not clear how we should convert methane generated by someone’s meat-eating lifestyle into an equivalent amount of CO₂, because it depends on which timescale we are considering.
But for the purposes of informing people about the ways in which their lifestyle is damaging the world, and providing a single summary figure in the form of calculator, it is necessary to pick on one timescale – and 100 years is the standard figure chosen.
The ‘sustainable’ figure of 1.5 tonnes per year is uncertain – an amount that the world’s oceans may be able to absorb. In this sense, it is sustainable – but stores of fossil fuels are finite, and so no emission level is sustainable in the very long term.”

Scope 1 – covers all Direct Emissions from the activities of individuals/organisations or under their control; includes fuel combustion on site such as gas boilers, fleet vehicles and air-conditioning leaks.
Scope 2 – covers Indirect Emissions from electricity purchased and used by individuals/organisations; emissions are created during the production of the energy and eventually used by individuals/organisations.
Scope 3 – all Other Indirect Emissions from activities of individuals/organisations, occurring from sources that they do not own or control; usually the greatest share of the carbon footprint, covering emissions associated with individuals’/organisations’ travel, procurement, waste and water.
For organisations, they look like this (for individuals transpose the subheadings into your home-life equivalents):

Source: GHG Protocol
